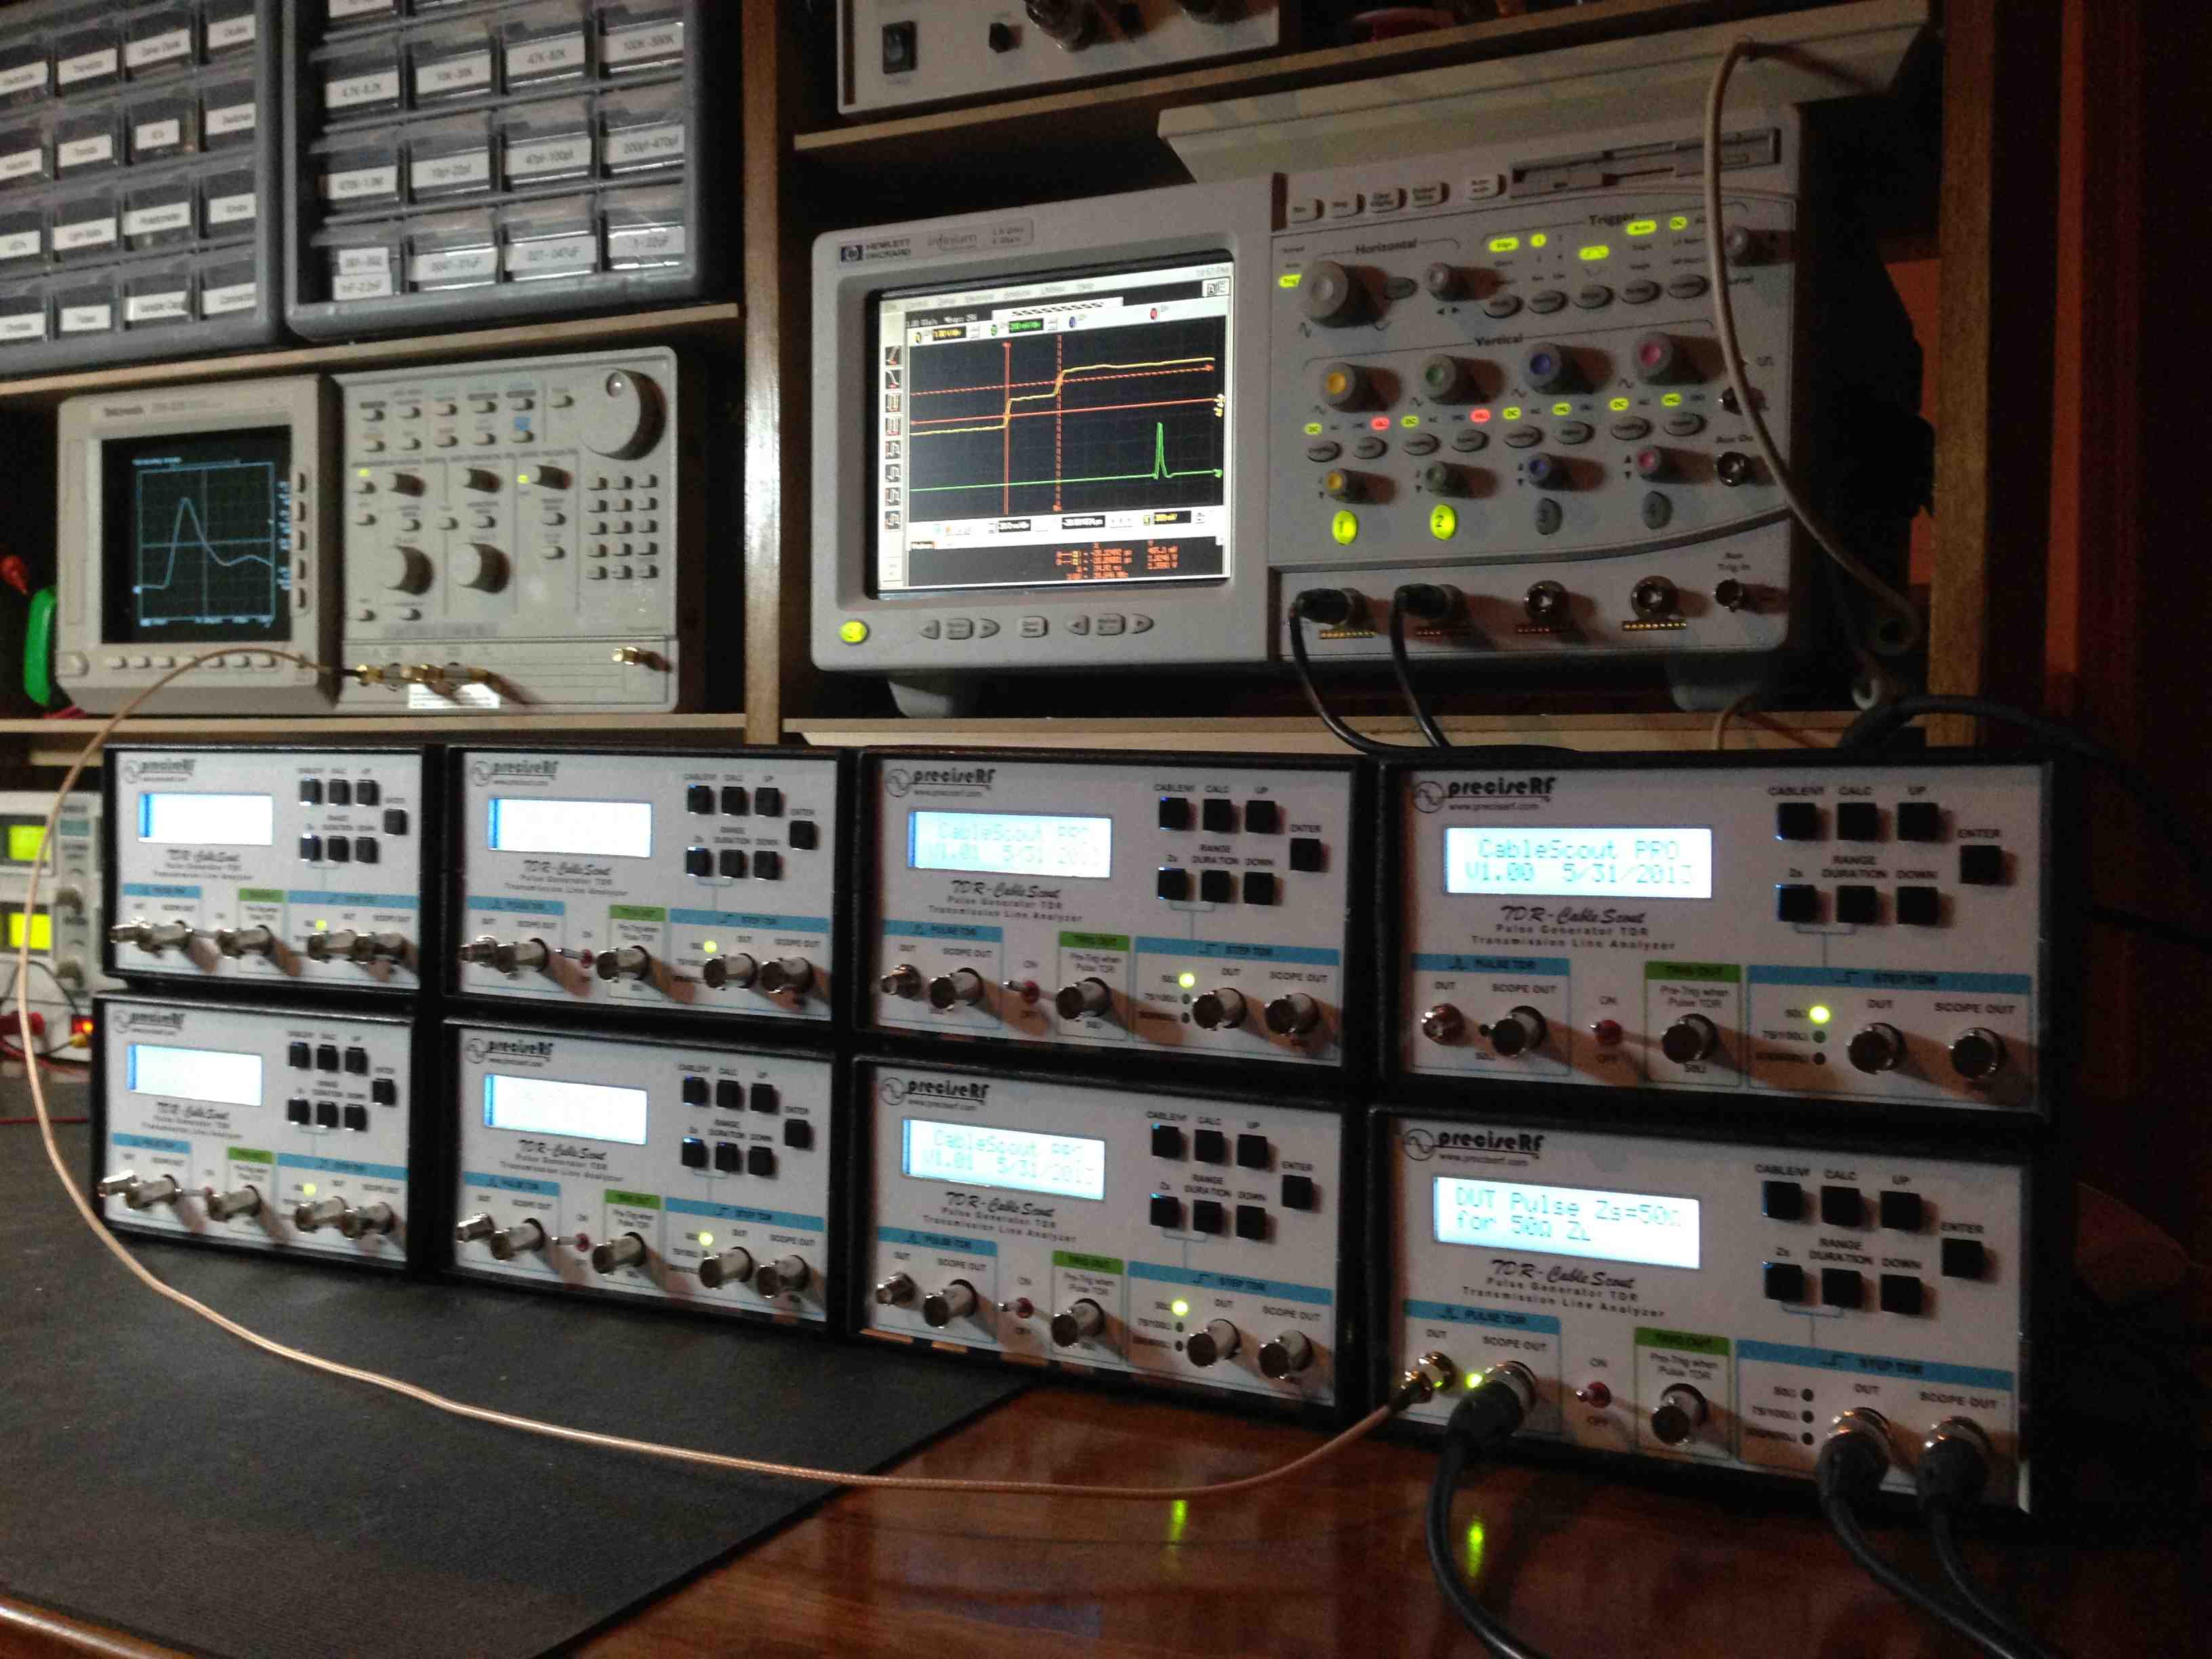
 Our latest manufacturing run (manufactured in the USA) of our popular TDR pulse generator now features individualy calibratd TDR pulse data and pulse outputs rise times times under 150 ps. Each unit in this manufacturing run calibrated and performed better than our published specifications. Feedback from current users has been positive, and no firmware upgrades are required.
Verify your transmission line quality and measure losses
In addition to measuring the actual cable impedance of your transmission lines, a feature especially popular is the ability to measure cable losses in dB per hundred feet. The fast rise time and narrow pulse width allows loss measurement by analyzing GHz harmonic contents and converting this signal into pulse integration using an ordinary 200 MHz oscilloscope. The TDR computer compares the input pulse to the output pulse given a known cable length and computes the loss in dB/100 feet at 100 MHz. While there are a number of 50 ohm cables for example, not all cables have identical losses. With the loss measurement feature, hams can verify their cable impedance with as little as a 12″ cable sample. See our video on making TDR cable measurement..
Those hams with older Tektronix sampling scopes can take advantage of the TDR pulse generator fast rise time by using the 100 ns pre-trigger output and as a result can view the leading edge of the pulse TDR waveform and achieve a stable display.
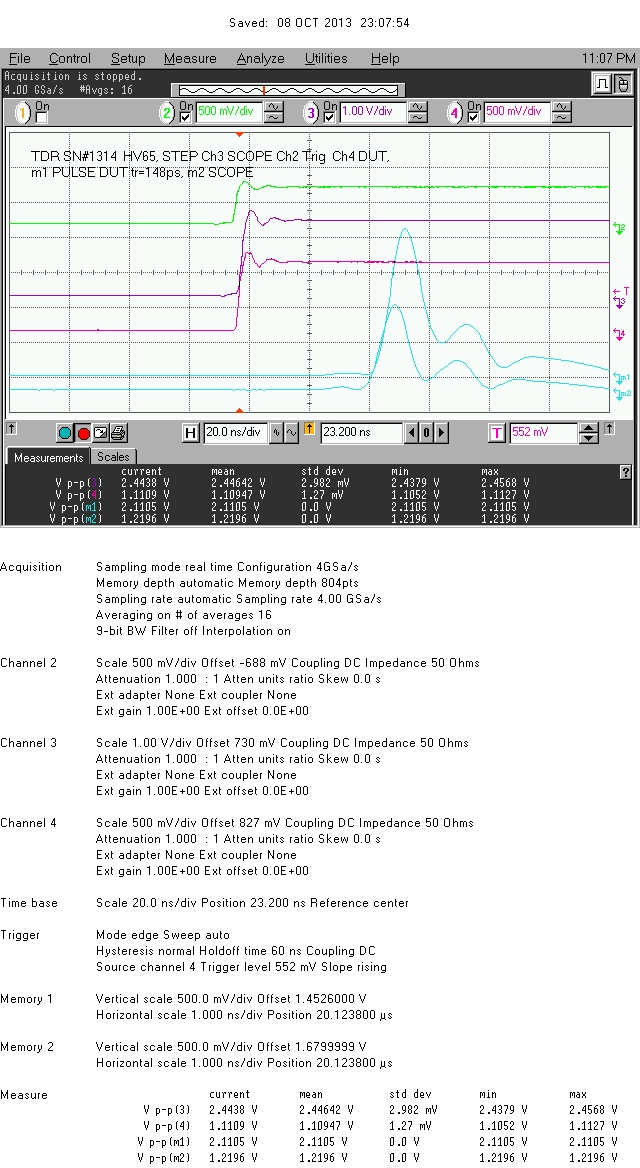 Calibration verification
For accurate and consistent results, Ham radio operators and experimenters rely on their test and measurement equipment accuracy. When making transmission and feed line impedance measurements step and pulse performance is especially important. Now, in addition to specifications published on our data sheets, each new TDR pulse generator is delivered with a comprehensive five channel display characterizing the each output from the TDR pulse generator.
In addition to measured values the calibration now includes actual values and statistical data such as mean, standard deviation, minimum and maximum values. Rise time performance is measured down to the picosecond level. Click on the image to view in greater detail.